Abstract Recently, rebar futures prices have exceeded the high point of December 2016, while production and inventory data show that this price increase is not a supply contraction, but a demand side expansion. In June, the official manufacturing PMI turned upwards to 51.7, which also means that the macroeconomic operation is better...
Recently, rebar futures prices have exceeded the high point of December 2016, while production and inventory data show that this price increase is not a supply contraction, but a demand side expansion. In June, the official manufacturing PMI turned to 51.7, which also means that the macroeconomic performance is better than the market expectations in April and May. The future economic trend determines how much the supervision can be in the game of fundamentals and policy, and how long it can last, which in turn affects the trend of the capital market.
In this report, we start from the demand side and use leading indicators to judge the future trend of the macro economy.
Let's take a look at the situation of fixed asset investment. Like most research reports, we mainly analyze the three major items of infrastructure investment, real estate investment and manufacturing investment. In 2016, these three items accounted for 73% of total fixed asset investment.
The growth rate of infrastructure investment has been declining since the beginning of the year, mainly due to the constraints of funding sources, including the fiscal revenue and expenditure pressure within the budget, the shrinking scale of urban investment bonds, the increase in capital costs, and the suppression of social capital participation in infrastructure projects.
Circulars 50 and 87 further increased the pressure on infrastructure financing sources. Circular 50 requires the city investment company to regulate debt financing. Financial institutions may not require or accept any form of guarantee letter provided by the local government, and the PPP model of the real stock bonds that have been popular in recent years, and the fixed income commitment of the industry fund priority partners. The illegal borrowing has been explicitly prohibited.
Document No. 87 regulates the government's purchase of services from the perspective of process. For the first time, in the form of a negative list, it is strictly forbidden to package infrastructure construction projects in various fields such as roads, railways, and airports into government procurement services. In recent years, the government has often used the means of borrowing money from the door.
The restriction on the purchase of service projects by the pseudo-government in the No. 87 document will force local governments to promote the investment and financing of infrastructure and public service projects to the PPP model. However, in the context of financial deleveraging, the increase in capital costs to the squeeze of the PPP project's net rate of return, as well as the contraction of liquidity, it is expected that the PPP model will have a limited boost to infrastructure investment in the short term.
The land reserve special bond and the toll road special bond pilot release means that there may be more special-purpose local government special bonds issued in the future, instead of urban investment loans and urban investment bonds. However, the above two special bonds are within the 800 billion this year, and there is no incremental contribution to infrastructure investment.
In the following months, infrastructure investment has the pressure to accelerate downward. On the one hand, the 50th document was released in early May, and the 87th document was released in early June. The central ministry's policy was released to the local government to issue supporting policies, and then to the implementation of the policy, there are time lags, and the policy effects will gradually appear over time. . On the other hand, under the strict supervision of local debt, some local governments or their subordinate institutions have withdrawn their letters of guarantee to financial institutions, and financial institutions have stopped lending, but these projects can also rely on cash for support for a period of time, and the subsequent months are missing. After external financing support, it may be suspended.
Let’s take a look at another leg that supports the economy – real estate investment. Real estate investment usually lags behind sales for 6 months, but in this round of real estate cycle, sales growth rate was high in April 2016, while investment growth rate was high in April 2017, lags a whole one. year.
In the future, the trend of real estate investment growth, the big probability is down, the question is how fast. In order to answer this question, we will split the real estate investment completion.
According to the use of funds, the completion of real estate development investment can be divided into five parts: construction engineering cost, installation engineering cost, equipment and equipment purchase cost, land acquisition cost and other expenses. In 2016, the proportion of these five items was 65.1% and 9.3% respectively. 1.4%, 18.3% and 5.9%.
Among them, the construction project, installation engineering and equipment and equipment purchase costs are directly spent on the construction and equipment of commercial housing, collectively known as Jian'an Investment. Jian'an Investment is equal to the construction area multiplied by the construction investment per unit area.
As other items in the real estate development investment are relatively low and difficult to predict, in this report, only Jian'an investment and land acquisition costs are analyzed. In 2016, the proportion of real estate development investment completion is 75.8% and 18.3%.
We can see that since Jian'an Investment accounts for three-quarters of the completion of real estate development investment, the inflection point of the two growth rates has basically coincided. However, the growth rate of Jian'an investment reached a high point in February this year, ahead of the high point of real estate investment growth in April, mainly due to the support of land acquisition costs.
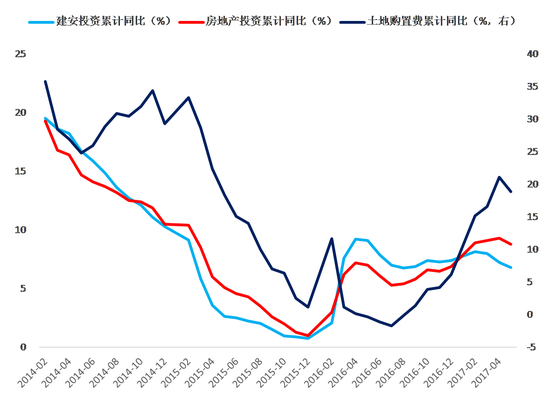
Exhibit 1: Supported by land acquisition costs, the growth rate of real estate investment only turned around in April this year (Source: Lianxun Securities, Wind)
In Jian'an Investment, the main construction area and completed area are affected by the construction area. From the historical data, there is a clear inverse relationship between the new construction of commercial housing and inventory data. This is also in line with reality, sales improvement, on the one hand to boost the developer's optimistic expectations for the future, on the other hand, developers have the incentive to replenish stocks after the inventory is reduced.
Despite the continuous upgrading of regulation and control, under the support of sales spillovers in hot cities and monetization of shantytowns, the growth of sales after this round of regulation has been slower than the previous rounds of regulation. The inventory area of ​​commercial housing began to decline negatively in November 2016, and the absolute amount has also decreased for three months.
But future sales face two pressures. First, after entering the second quarter, most cities have no incremental control policies, and the demand driven by the spillover of hot cities has weakened. Second, according to the documents of the provinces, municipalities and autonomous regions, most require 60% of the shed reform tasks to be completed by the end of June and 100% in the third quarter. The growth rate of commercial housing sales in the third quarter may be good, but it is expected to slow down significantly in the fourth quarter.
Under the slowdown of sales, the developer has not seen the start of construction, and the growth rate of new construction area has been reduced for two months.
Compared with the newly started area, the impact on the construction area is more obvious is the stock of real estate projects. In the construction area of ​​7.59 billion square meters in 2016, the newly started area only accounted for 22.0%, most of which was the area that was started in previous years without completion.
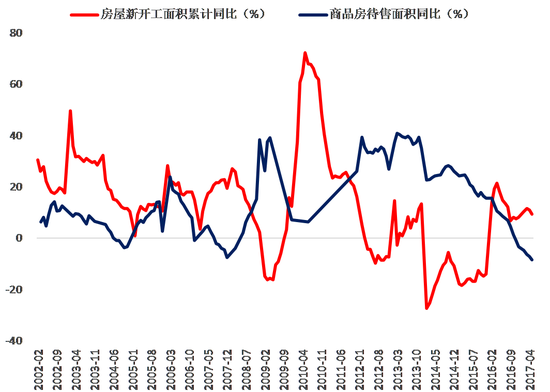
Chart 2: There is a clear inverse relationship between the new construction area of ​​the commercial housing and the inventory (Source: Lianxun Securities, Wind)
We use the growth rate of the completed area as the dependent variable, the growth rate of the new construction area is the independent variable, and the regression analysis is performed for each lag period. It was found that the regression of the two regressions was the highest when the lag was 19. This result is also in line with reality, the construction period of real estate projects is usually around one and a half years. Since February 2016 to August of that year, the growth rate of new construction area has shown a significant acceleration. According to our previous calculations, it is expected that the projects started in September 2017 and the first three quarters of last year will be completed.
The completed project is no longer under construction. We believe that the growth rate of real estate investment will have a greater slowdown since September this year.
At the same time, the growth rate of new construction area has soared from 13.7% in February 2016 to 21.4% in April 2016. After 19 months, that is, in November this year, the growth rate of real estate investment may further weaken.
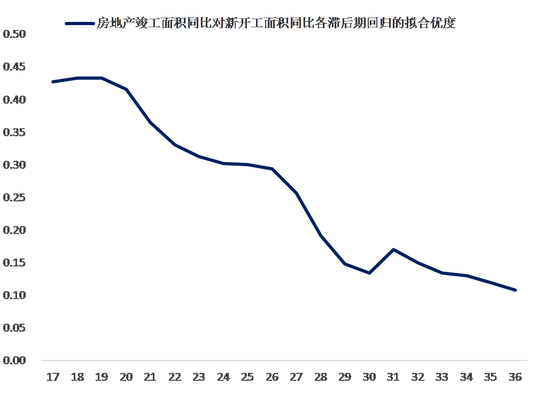
Exhibit 3: The growth rate of the completed area is the best when the new development area is delayed by 19 (source: Lianxun Securities, Wind)
The land acquisition cost accounts for nearly 20% of the real estate development investment completion, and its impact on the growth rate of real estate investment is not as small. According to historical data, land acquisition costs lag behind changes in commercial housing sales. After the sales of commercial housing increased, the profits of real estate enterprises rose, and the willingness to acquire land became stronger. In the upward phase of this round of real estate cycle, the sales volume and price rose, and the sales growth rate reached 55.9% in April 2016. As sales continued to improve, the growth rate of land acquisition costs also ushered in an inflection point in July 2016.
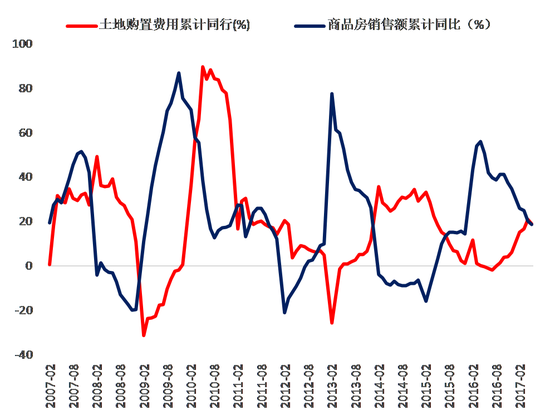
Exhibit 4: Land purchase costs lag behind changes in commercial housing sales
After the land acquisition cost growth rate reached 21.1% in April this year, it began to decline in May, and we believe that this trend will continue in the future. First, the sales growth rate has dropped from 55.9% of the highest point to 18.6% in May this year, which will inhibit the willingness of enterprises to acquire land.
Second, the Ministry of Housing and Urban-Rural Development implements the policy of land dynamic supply according to the inventory situation, which will limit the supply of land in third- and fourth-tier cities. The main driving force for sales this year comes from the third- and fourth-tier cities, and the sales improvement is limited by the policy.
Third, the year-on-year growth rate of land acquisition costs began to pick up after July 2016. From the perspective of the base, the growth rate of land acquisition costs will continue to slow down.
In summary, we believe that the slowdown in real estate investment growth is a trend. Beginning in September, as the project was completed one after another, the supporting role of real estate investment was weakened, and the downward pressure on the economy increased. This pressure will be further highlighted in November.
After analyzing the trends in infrastructure and real estate investment, let's take a look at the manufacturing situation.
From 2012 to 2014, the trend of growth in manufacturing investment growth and manufacturing profit growth remained highly consistent. Beginning in 2015, this correlation has weakened and even often deviated. The possible explanation is that the enterprises in the economic downturn have insufficient confidence in the future, and the improvement in profits is not enough to drive the manufacturing enterprises to expand their production capacity. This is more obvious in the first half of 2016.
Therefore, the improvement of profits is not a sufficient condition for the improvement of manufacturing investment.
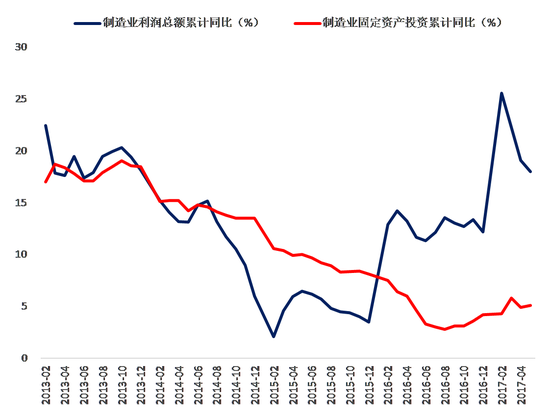
Exhibit 5: The correlation between manufacturing investment growth and profit growth after 2015 is weakened
In May 2017, 32 manufacturing sub-sectors with data, cumulative profit growth rate and cumulative investment growth rate, when doing scatter plots, found that the two are not positively related, and even have a negative correlation. 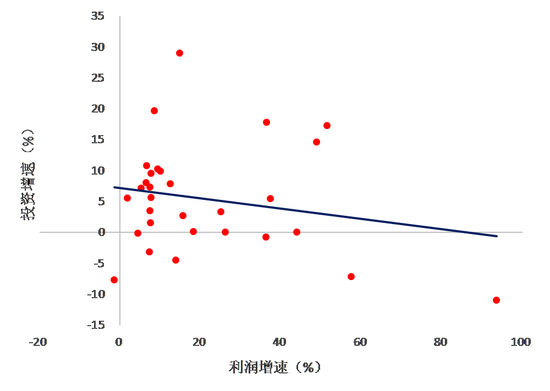
Exhibit 6: May 2017 data shows that manufacturing sub-industry investment and profit are not positively correlated
We believe that this is related to industry differentiation. This round of industries with faster profit growth is mainly concentrated in the four industrial chains of steel, coal, nonferrous metals and chemicals. All of them are industries with overcapacity, and capacity expansion is limited by policies. At the same time, these industries are mainly in the upstream and midstream. The improvement of profits comes from the squeeze of profits from other industries, which limits the capital expenditure of other industries. We will judge the trend of manufacturing investment from the perspective of cost. From the historical data, the three-year mid-term maturity yield rate minus the actual interest rate measured by the PPI year-on-year, after 6 months lag, has a significant inverse relationship with the growth rate of manufacturing investment.
The monthly average of the 3-year AA+ mid-term maturity yields began to show an overall upward trend after November 2016. The PPI has dropped significantly since the beginning of February this year.
Judging from the leading position of real interest rate to manufacturing investment, the growth rate of future manufacturing investment is not optimistic.
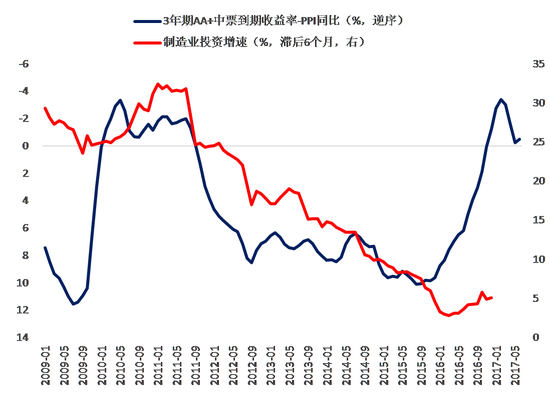
Exhibit 7: Real interest rate is ahead of manufacturing investment for about 6 months
In 2016, China's top three export destinations were the United States, the European Union and Japan, accounting for 18.4%, 16.2% and 6% of China's total exports, respectively, and the sum of the three exceeded 40% of China's total exports.
The improvement in China’s exports this year is related to the economic recovery of the above-mentioned countries and regions. Since August 2016, the US ISM manufacturing PMI, Japanese manufacturing PMI and Eurozone manufacturing PMI have generally shown an upward trend, especially in the Eurozone's PMI in June this year hit a six-year high.
We use China's export growth rate to the US, Japan and the Eurozone as the dependent variable, and the regression analysis of the manufacturing PMI of the corresponding country as the independent variable. From the perspective of goodness of fit, it was found that the US ISM manufacturing PMI, the Japanese manufacturing PMI and the Eurozone manufacturing PMI were ahead of China's export growth rate of 5 months, 7 months and 6 months respectively.
Therefore, from the PMI of the above three countries and regions, China’s exports to major trading partners have been supported in the following months.
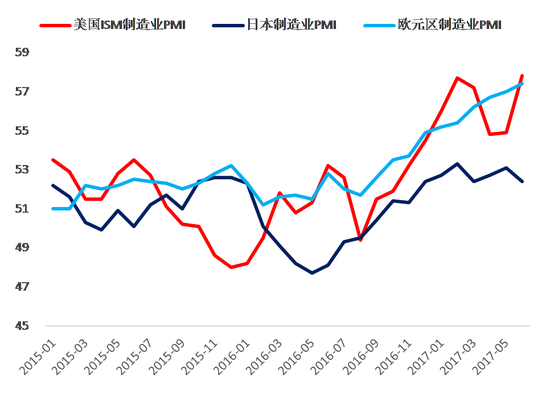
Exhibit 8: Manufacturing PMI in the US, Eurozone, and Japan has been on the rise since August 2016
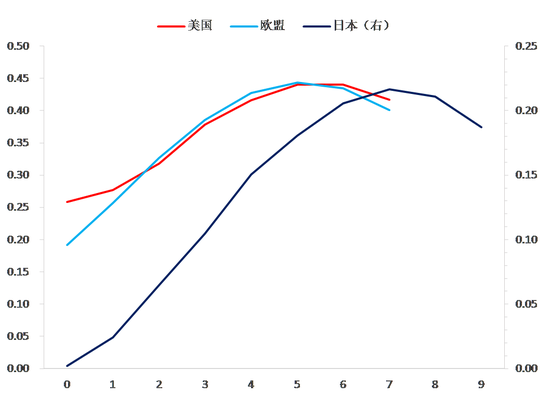
Figure 9: The lead time of the US-European manufacturing PMI to China's export growth rate from the goodness of fit
Another leading indicator is the RMB real effective exchange rate index. Data from 1996 show that the RMB real effective exchange rate index, which lags behind for six months, has a strong negative correlation with China's export growth rate. From January to May this year, the real effective exchange rate index of the RMB continued to drop from 123 to 118. According to historical experience, this index also supports China's exports in the following months.
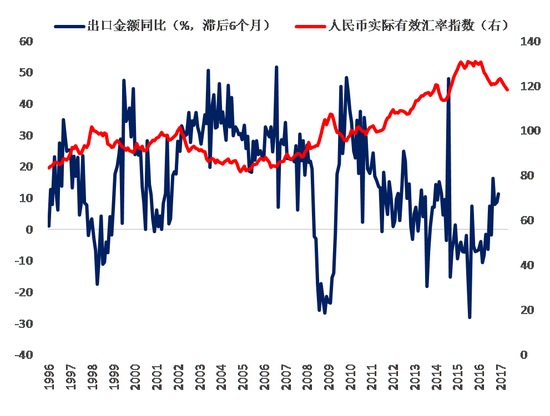
Exhibit 10: The RMB real effective exchange rate index also shows support for subsequent Chinese exports
However, it is not appropriate to overestimate the role of exports in economic growth. Compared with the export data, the import data is more conspicuous. The trade balance from January to June this year is still negative, but the expenditure method accounts for GDP based on the net export of goods and services. Based on the above, we believe that the probability of the economic situation in the third quarter is down. On the rhythm, the real estate investment that has obviously supported the economy in the past two years, with the start of the new project started in the first half of last year, will start in September this year, which will drive the economy to accelerate downward pressure in September, and this pressure is November will be further highlighted.
(The author of this article: Managing Director of Lianxun Securities.)
S32205 Ap Tube,S32205 Duplex,Round Steel Tubing Sizes,Seamless Stainless Steel Tubing
Zhejiang Ruimai Stainless steel Tube Co.,Ltd. , https://www.ruimaitube.com